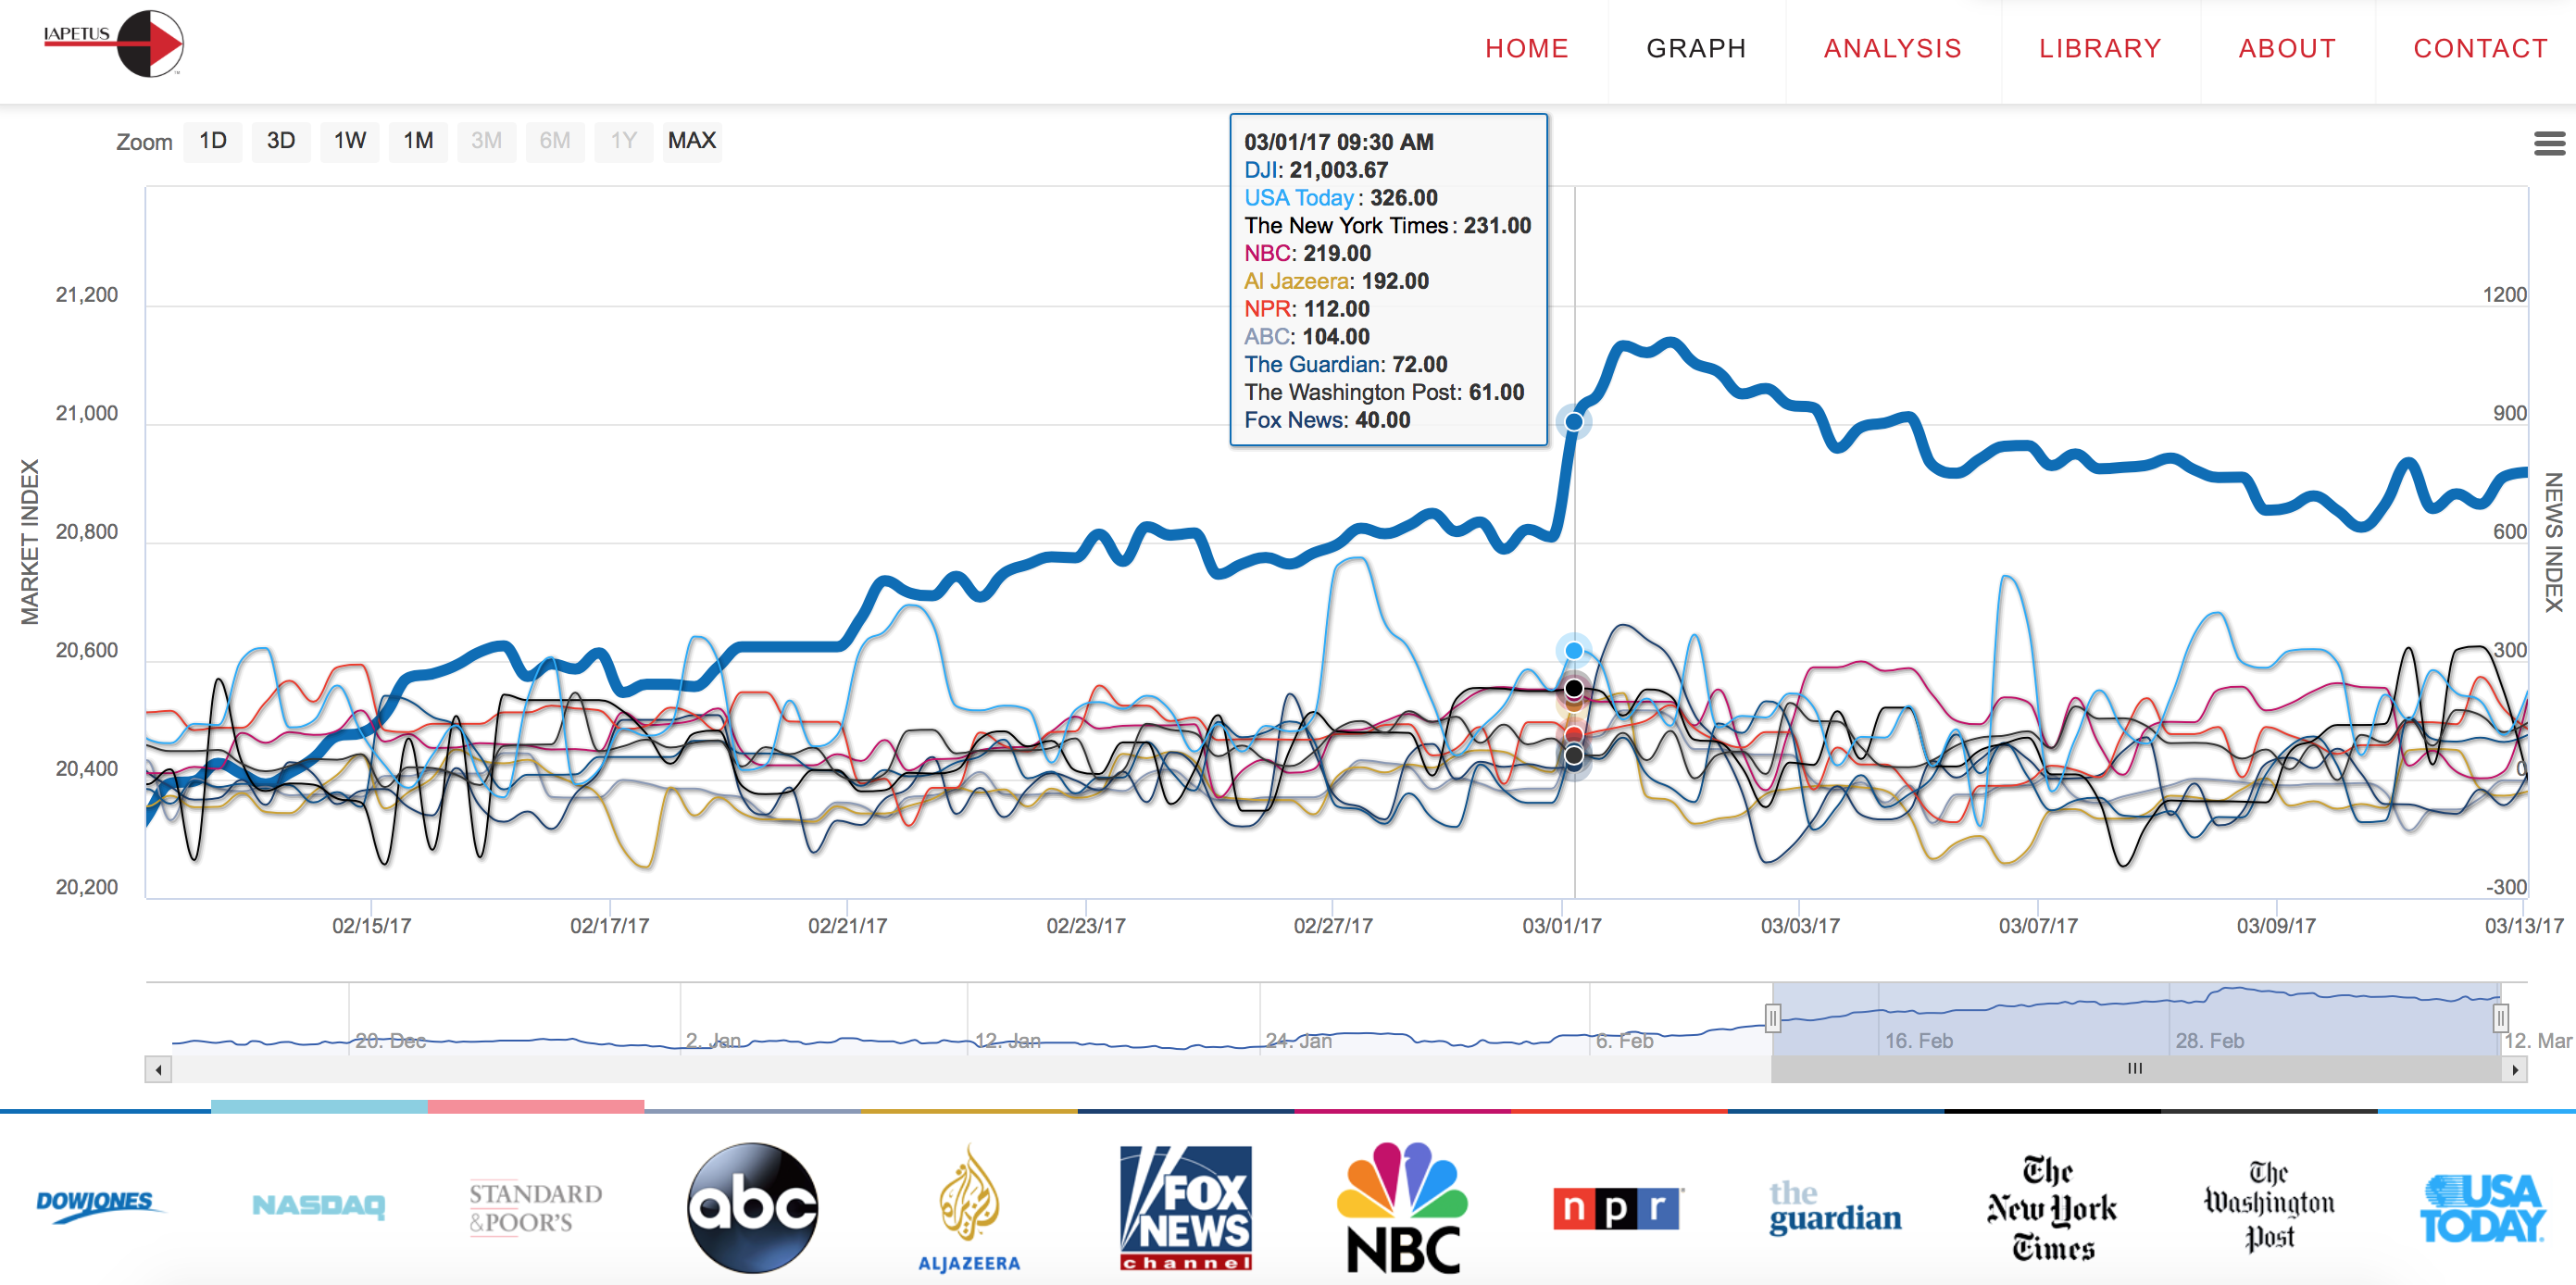
What we see on this Graph is that on March 1st the Dow had a great day climbing a few hundred points. Our Sentiment Index for all 9 news outlets all showed positive feedback midday as markets were active.
This is an amazing find adding conviction to the claim that our model is correlated to the market. Our weighed trigger word library over time is starting to benchmark market volatility. We are starting to understand the patterns and clustering of our sentiment data research and look forward to sharing some incredible insights showing how news is a barometer for market trending.
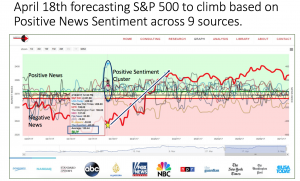
It is very rare that all 9 news outlets are all positive at the same time. This is a marker that we’ll be looking at closer and in the future as an indicator for positive stock market trending.
So what does it mean? If we see our model produce data that all the news sources we are following are in the positive sentiment range, this may be a good buying opportunity, as this graph supports.


